Business
Intelligence Solutions
Knowledge via Interactive Graphics

Knowledge via Interactive Graphics
Decision makers who are incorporating the results of data analytics into actual business processes do not want to deal with the technicalities of data processing. Business intelligence (BI) tools and solutions provide such decision makers with easy-to-comprehend summaries of the results in graphical and interactive form. BI involves calculating KPIs and other metrics, generating reports, dashboards and scorecards, and performing near real-time monitoring. Also, non-technical decision makers who understand both the data and business objectives should be able to readily create their own custom reports and dashboards.
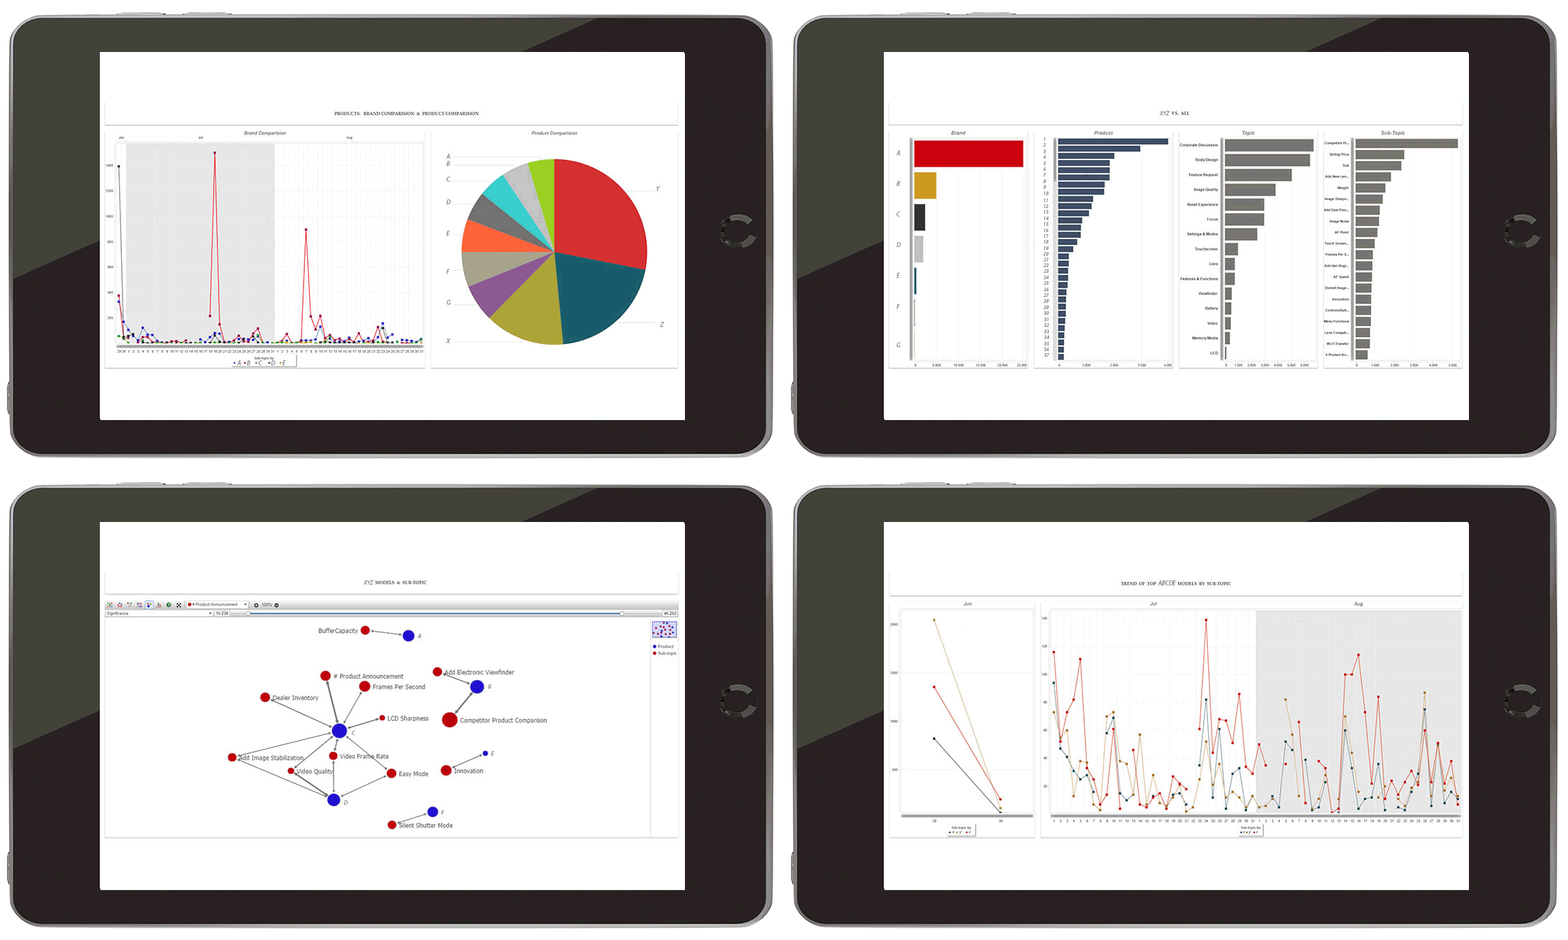
Megaputer provides a combined data mining and BI system for extracting valuable knowledge from gigabytes of raw data and presenting the findings in simple graphical form. This BI system, called PA Web Reports™, provides managers and executives with everything they need to lead the charge and make prudent data-driven decisions.
PA Web Reports facilitate packaging the results of advanced analytics into custom graphical reports. These interactive reports deliver the results of the analysis to the desks of decision makers, allowing the company to be nimble and proactive. Web reports allow decision-makers to monitor key metrics as well as perform ad-hoc queries and drill-down to the information they need.

Dynamic scorecards and business dashboards powered by PolyAnalyst™ can be customized to your business needs and shared with decision-makers quickly and easily. With ETL capabilities, fast processing of large data sets, and a convenient drag-and-drop interface, data analysts can easily load data from multiple sources, design customized analysis scenarios, and create graphical reports accessible to specified business users. Dynamic web-based reports and dashboards allow decision-makers to monitor key metrics as well as perform ad-hoc queries and drill-down to the information they need.
PA Web Reports are so easy to create that even a non-technical user can quickly build an informative custom report. This capability broadens the use of PA Web Reports throughout the organization and helps you make informed business decisions.
Dynamic scorecards and business dashboards can be customized to your business needs quickly and easily. Task scheduling and automated reporting features facilitate peak BI capabilities. The system can perform sophisticated calculations on newly acquired data to update the interactive reports and dashboards viewed by business users across the organization.


