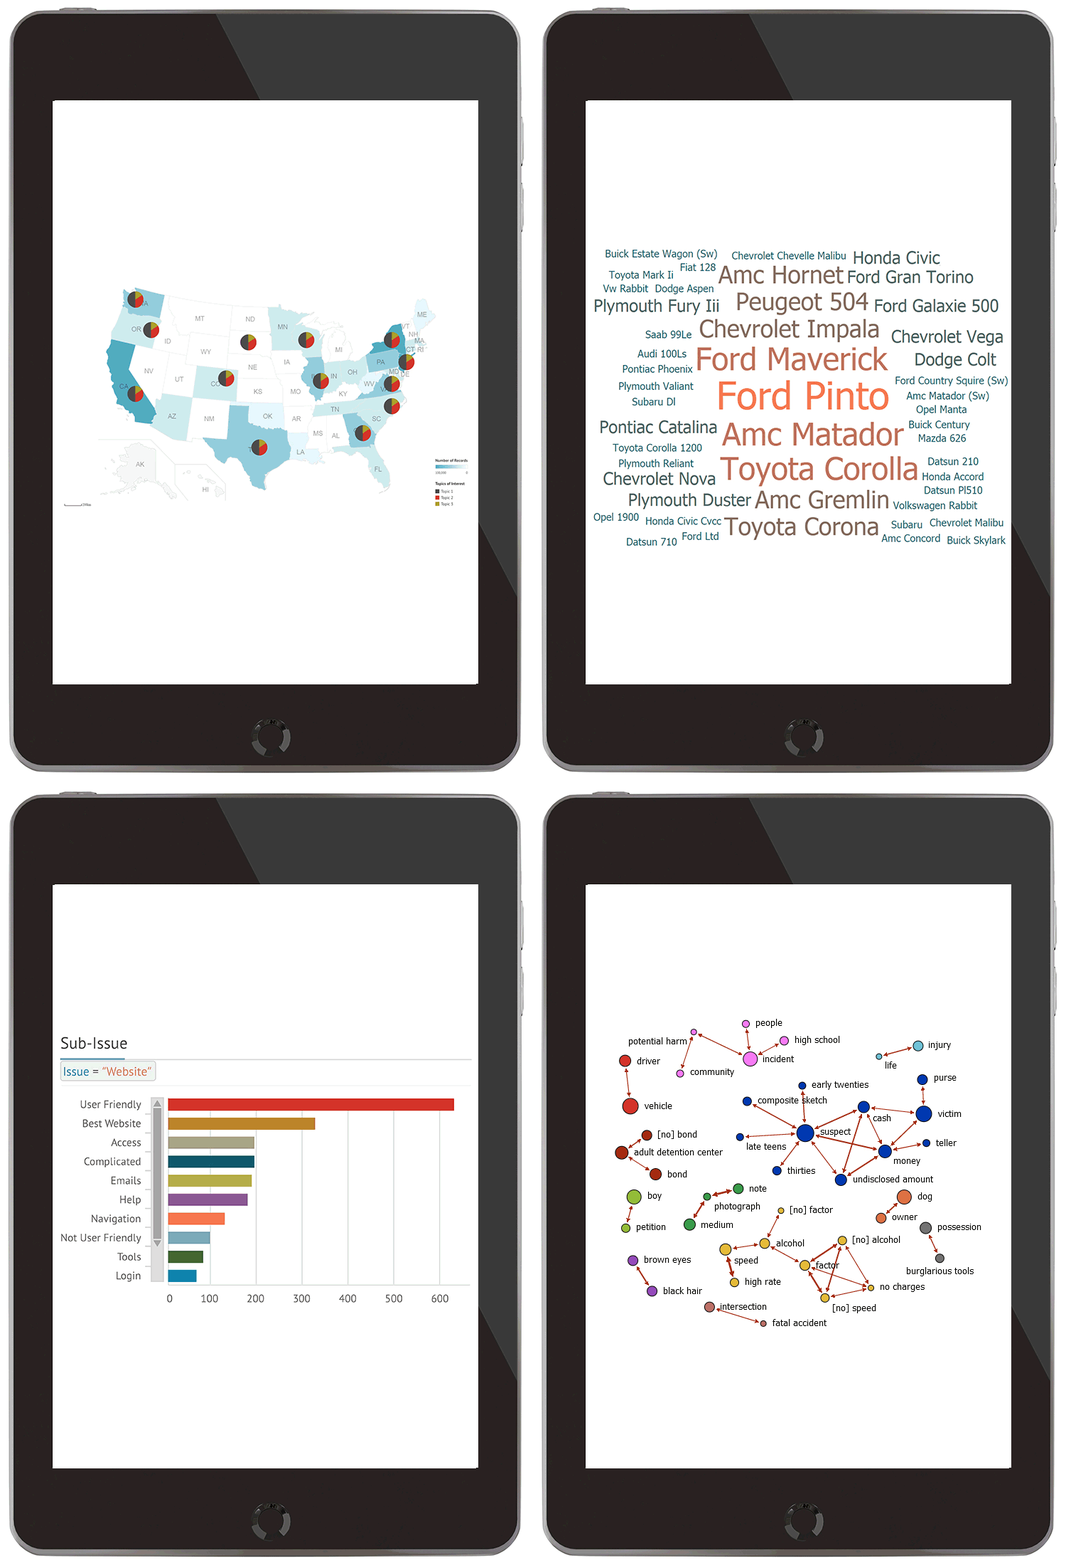
PolyAnalyst Web Reports
Visual insights

Visual insights

There is a gap in advanced analytics. While only a few highly trained data scientists in the organization can perform the core analysis, numerous potential consumers of the obtained results are waiting to incorporate them into actual business decisions. They are not technically savvy, and they have no means to directly access the results of analytics. This prevents converting valuable insights into real business processes.
PolyAnalyst Web Reports™ bridge this gap by providing a means for delivering the results of advanced text and data analysis to non-technical users via intuitive graphical reports. These interactive reports can be quickly customized to the specific needs of individual decision makers. Non-technical users gain direct access to analytic insights, bypassing all complexities of advanced analytics.
PA Web Reports offer:

PolyAnalyst Web Reports are easy to build using an intuitive drag-and-drop interface. You can even create a report based on a single data table. However, the reports truly shine when they provide a graphical summaries of results generated by executing a sophisticated text and data analysis scenario.
Traditional reporting systems lack serious data manipulation and analysis capabilities, and many data mining systems offer mediocre reporting. PolyAnalyst addresses these shortcomings by combining the best capabilities from both worlds: it enables simple creation of custom graphical reports summarizing the results generated by multi-step data mining scenarios.
Check out examples and explore custom reports that were easily made using PolyAnalyst by visiting the PolyAnalyst Web Reports Gallery.
PolyAnalyst Web Reports provides a powerful and flexible platform for creating custom analytical solutions addressing specific business tasks. Check out the following examples: