As the saying goes, “mo’ data, mo’ problems.” Well, that’s not quite the saying and that’s not quite what we mean, but it certainly is true that large data comes with some problems that need to be solved. There are two ways that data can be “big.” Traditionally, Big Data is considered large literally by its physical size in terms of the memory space it consumes. In this article, we’re considering another type of “big” data, which we like to call Wide Data. Wide Data is unstacked tabular data that consists of large amounts of columns or variables, usually in the hundreds and above. Wide Data and Big Data are often overlapping but they are not necessarily the same: for example, Wide Data can be shallow, with relatively small number of rows – but large number of columns. Wide Data is common and comes with its own set of problems that need to be addressed in any analytical setting. Next, let’s discuss those problems.

The Problems of Wide Data
One issue about wide Data is that it is bulky, and this presents challenges that aren’t present in more compact datasets. For example, a person can quickly scan a table of a few columns, maybe even a dozen or more, to summarize what it contains. That quick scan will tell a person what sort of information is contained there, determine if the data is sparse, and provide a rough estimate of the range and variance of the data. This sort of quick summarization is impossible with Wide Data. Even scrolling through column names (if they are informative at all) takes some time to do, and in the end, it is usually impossible to retain all that information.
Not only is Wide Data confusing for us humans, but it can also be confusing for machines as well if we have an especially large number of columns. If we want to create a machine learning model with Wide Data, our model might suffer from a complexity problem. A large number of inputs to some machine learning model can make the training of this model either unstable or time-consuming.

So, what to do? Large numbers of columns aren’t ideal for either humans or machines, but we don’t want to just throw out columns randomly to reduce the size of the data, as we could risk losing important data. The solution is dimensionality reduction, a common technique in data science. Dimensionality reduction will reduce the number of columns that we have in our data while minimizing any loss of information as a result. These techniques are extremely useful in cutting out the fat from data while retaining the value.
Dimensionality Reduction in PolyAnalyst™
PolyAnalyst™ contains several built-in methods for performing dimensionality reduction. We’ll highlight a couple of these below.
The first method is Data Simplification. This process scans data to identity columns that are nearly uniform. A column with almost no variation is very uninformative and could be dropped entirely. Additionally, Data Simplification compares the columns with one another to see if there are any that are nearly identical. These columns can be triaged so that only one remains in the dataset to avoid unnecessary duplication. In addition to Data Simplification, Correlation Analysis can be performed to discover correlated variables. While not identical, strongly correlated variables serve a common purpose and we could consider cutting down to one in this case as well.
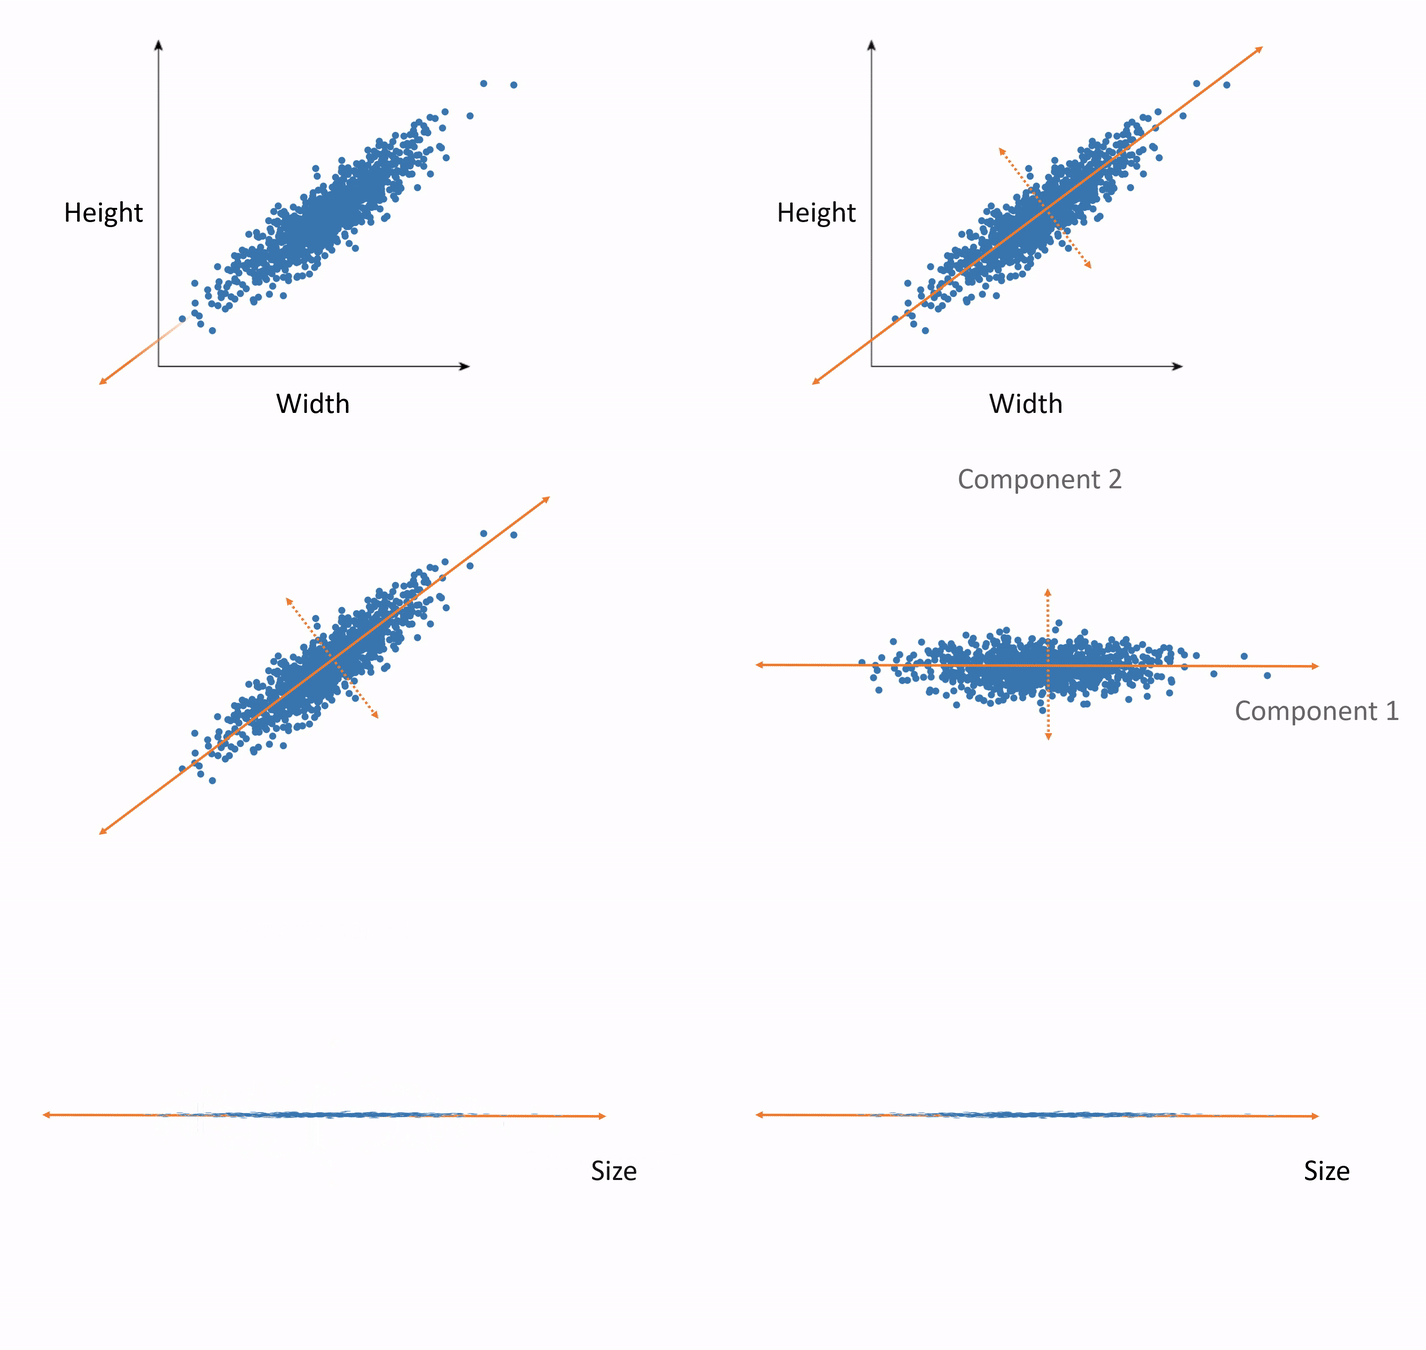
The second method is Factor Analysis, which includes techniques such as principal component analysis. The goal of this method is to find the vectors along which most of the variance occurs in the data, reorient the data along those vectors, and discard the vectors in which little variance occurs. This is best understood with an animation.

In this example, we have measured and plotted only two variables—height and weight. We can see the direction along which most of the variance occurs. This is the principal component. Now we rotate our data such that this direction is our horizontal axis and the orthogonal direction is the vertical axis. This destroys the semantic meaning of these axes of course, but this not a big deal. Where they were once semantically width and height, they now hold no such meaning. We will be able to regain the meaning after performing the analysis in the smaller number of dimensions and rotating the results back to the original axes. Now, if we would like to shrink the size of our data, we can throw out the vertical axis, which exhibits little variance. Thus, we have eliminated an entire variable but preserved the majority of the useful information, which simplifies further analysis.
Stay tuned…
Wide, bulky data is fairly common in the world, and although it comes with some problems, these can be managed with the techniques described here, such as Factor Analysis and Data Simplification. Once our data is manageable, PolyAnalyst has a wide range of modeling solutions. Stay tuned for more discussions about data analysis!
